Python Portfolio

This post is a portfolio of Python-related work I have completed up to August 2022.
ImageToRecipe: Fetching relevant recipes from images
- Builds on the techniques I used for FunTech
- NLTK for text preprocessing
- pyLDAvis for LDA analysis using food image titles and recipe titles
- PyTorch to create Convolutional Neural Network (CNN) classifier, taking in recipe information and outputting image data
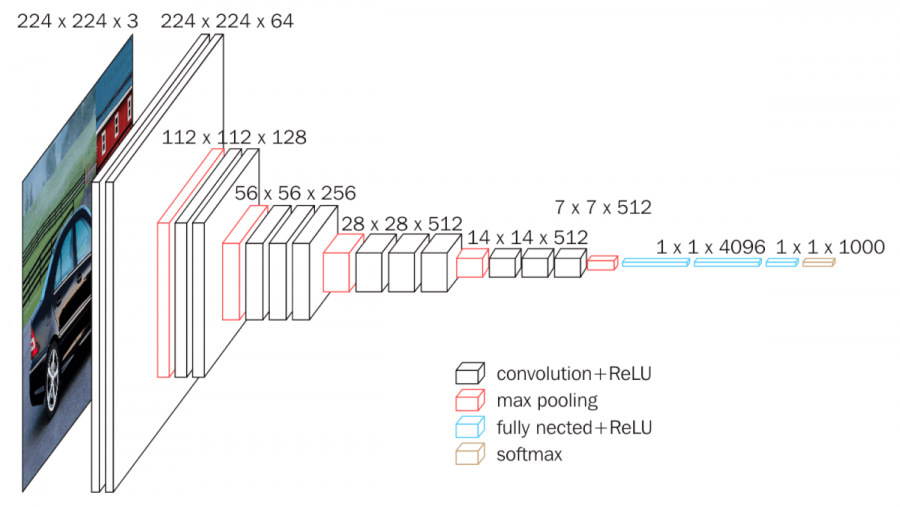
VGGNet, a type of CNN, used for ImageToRecipe. We specifically used the VGG-16 version
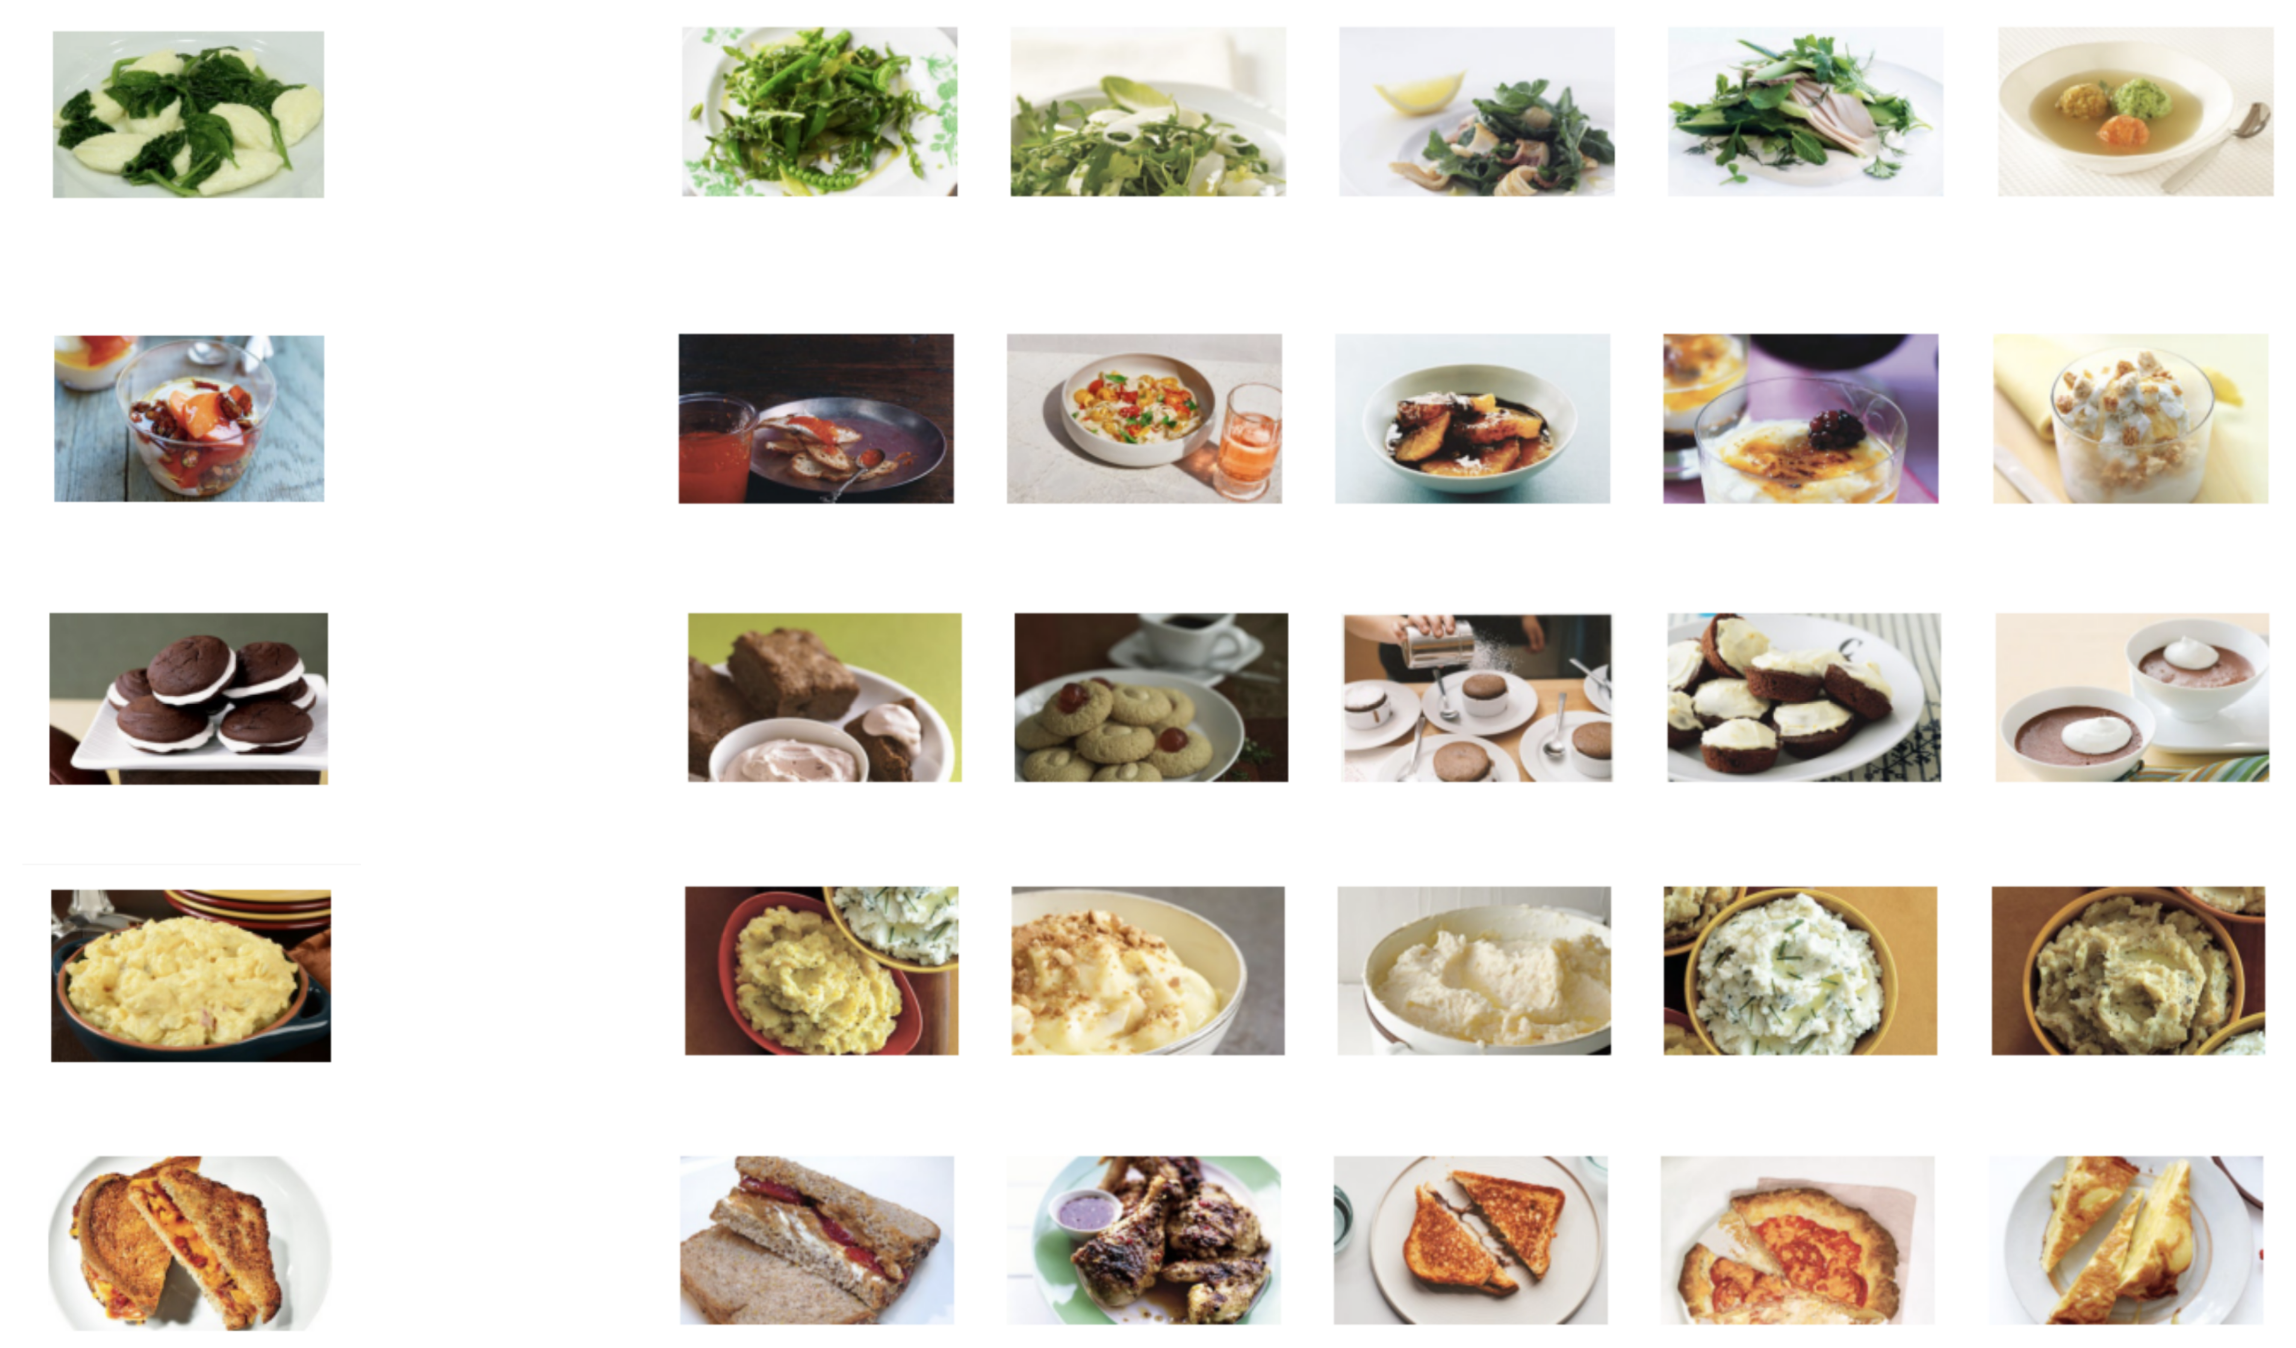
Results of the ImageToRecipe on test dataset
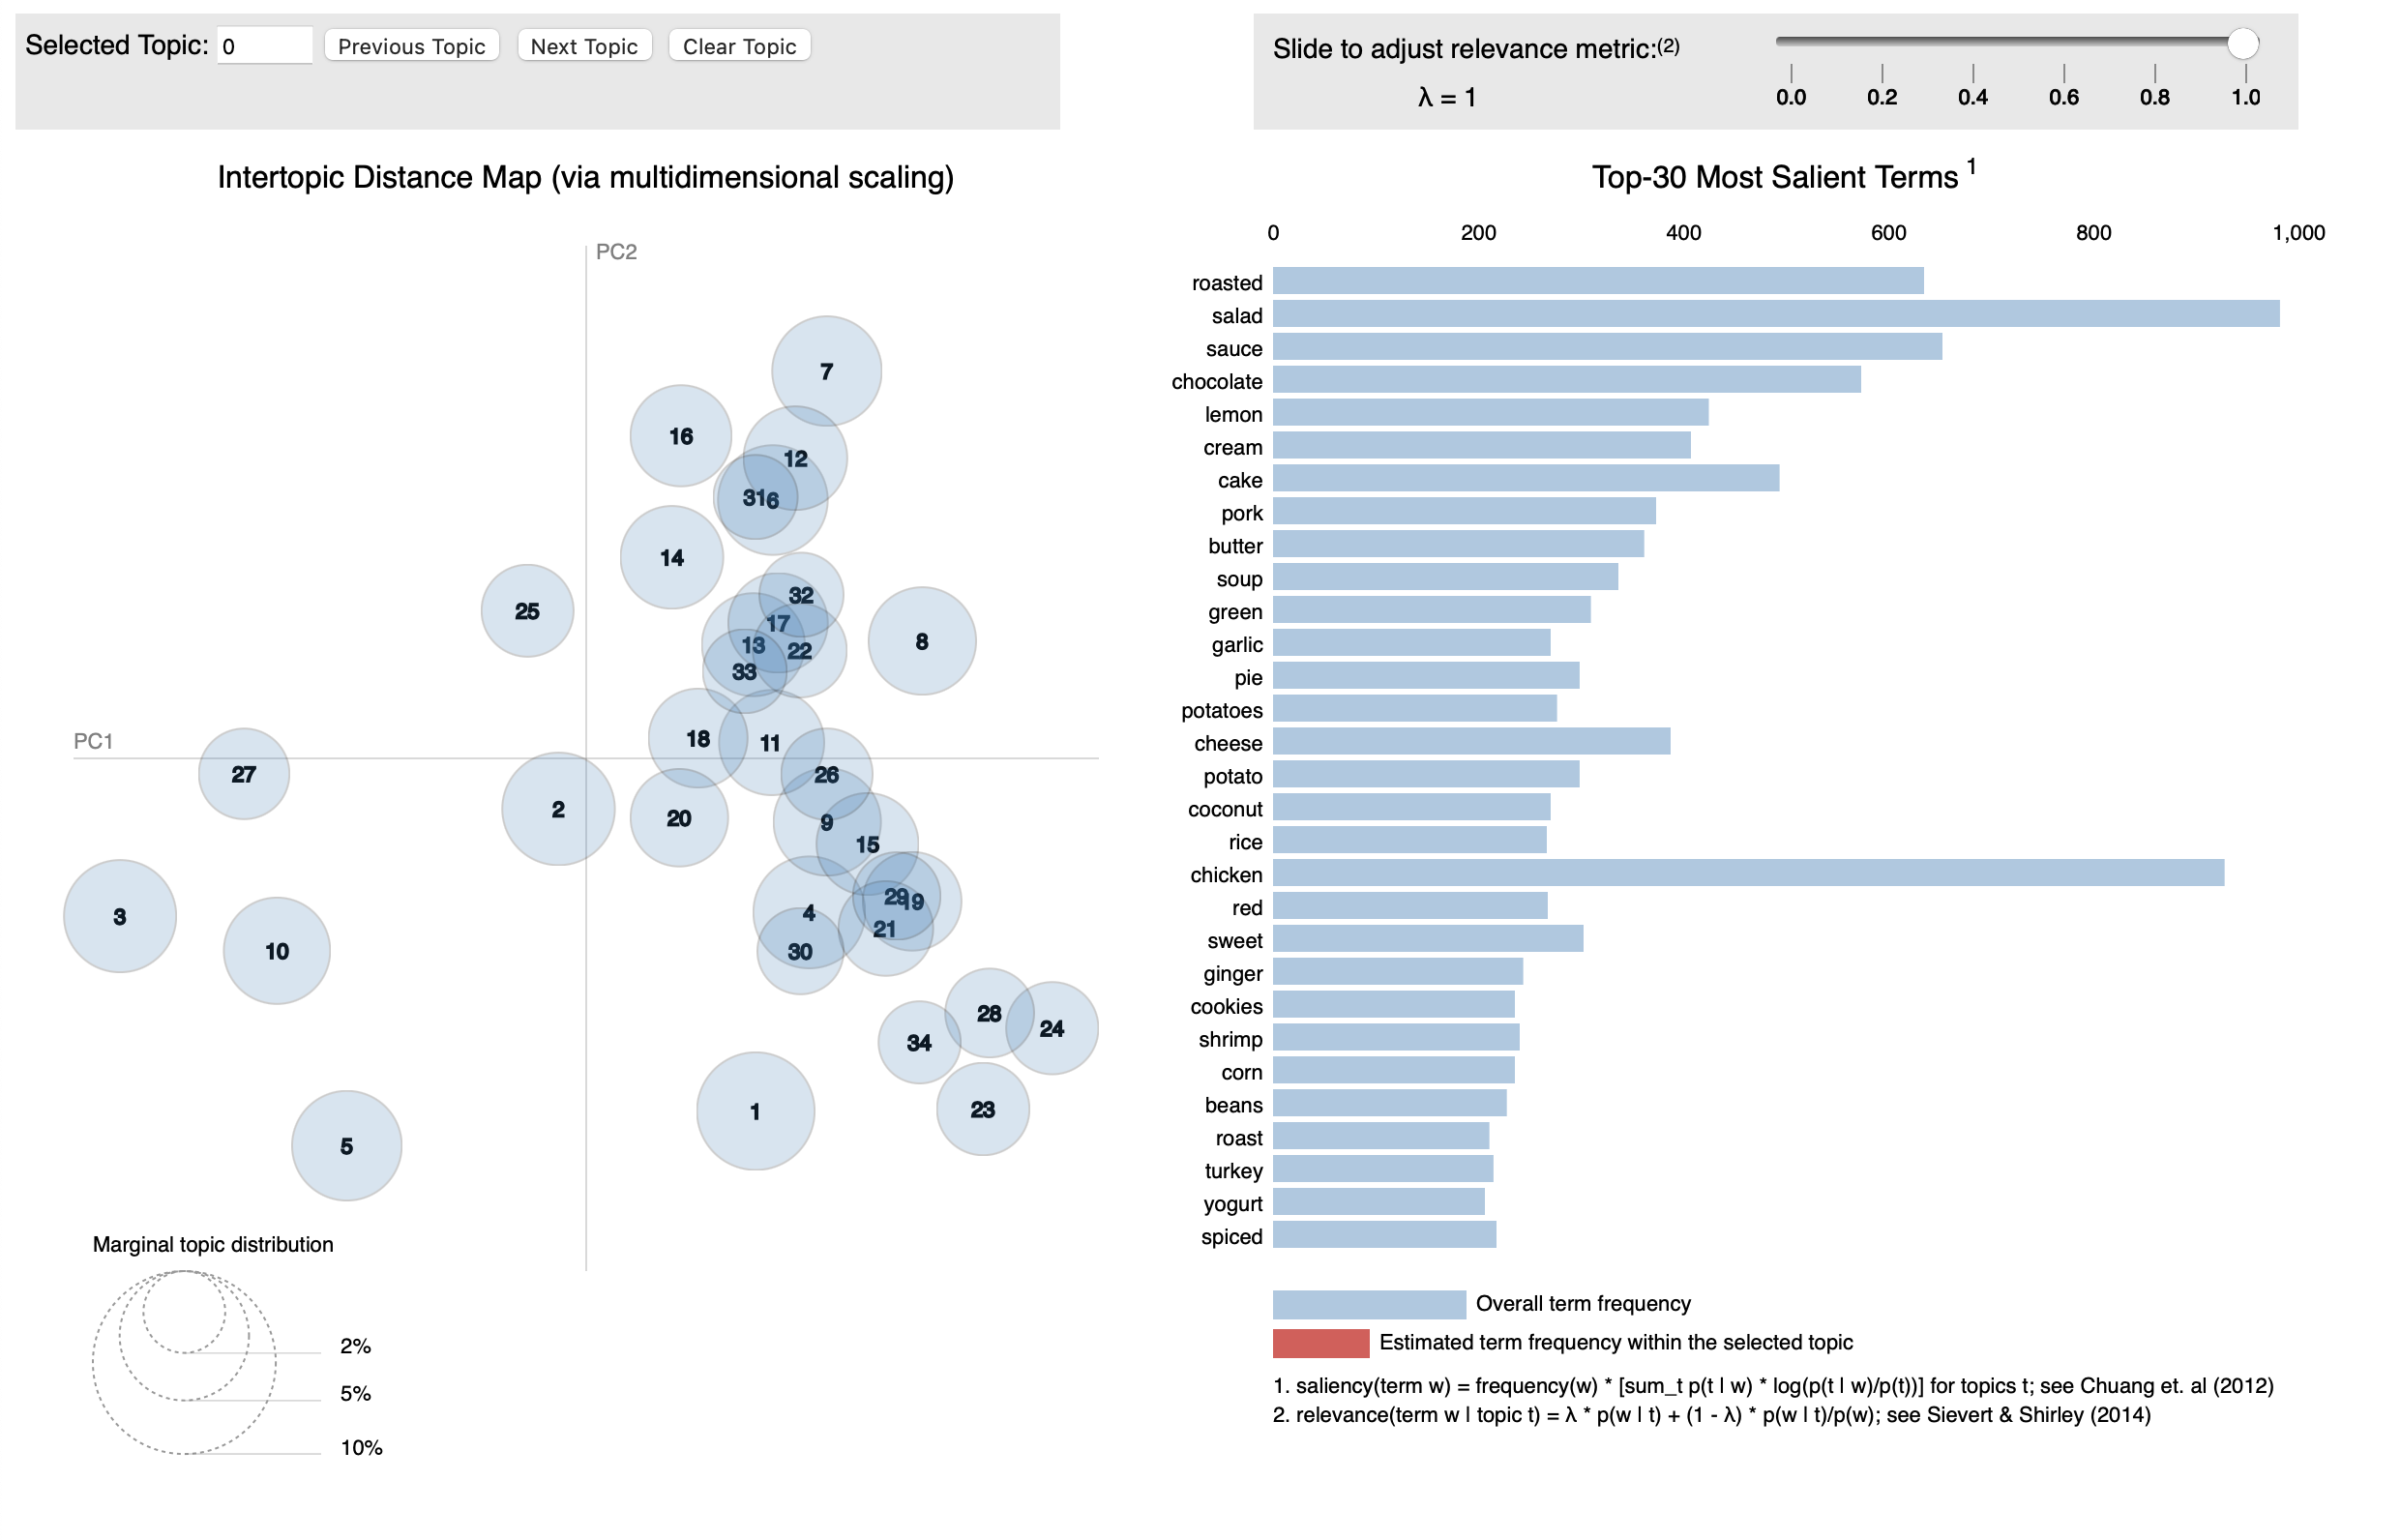
Matplotlib visualization of ImageToRecipe dataset using pyLDAvis
FunTech: Sentiment analysis of Fed statements
- Selenium + BeautifulSoup to make a web crawler for relevant information regarding Fed statements, including meeting agendas, meeting proceeds, and Blue Books / Teal Books
- NLTK for text preprocessing, including n-gram analysis, viterbi word splitting, and part of speech (POS) labeling to correct potential misformatting of text and filter out unwanted parts of text
- pyLDAvis to perform Latent Dirichlet Allocation, a topic modeling machine learning algorithm, of cleaned text and create matplotlib visualizations of the topics
CoronaDigest: A personal COVID 19 dashboard
- gensim to aggregate COVID-19 related news using text summarization algorithms
- Python requests to pull stock activity in real-time via APIs
- Used matplotlib + seaborn to create 3D globe visualization of COVID activity
- Flask + MongoDB for full-stack web application
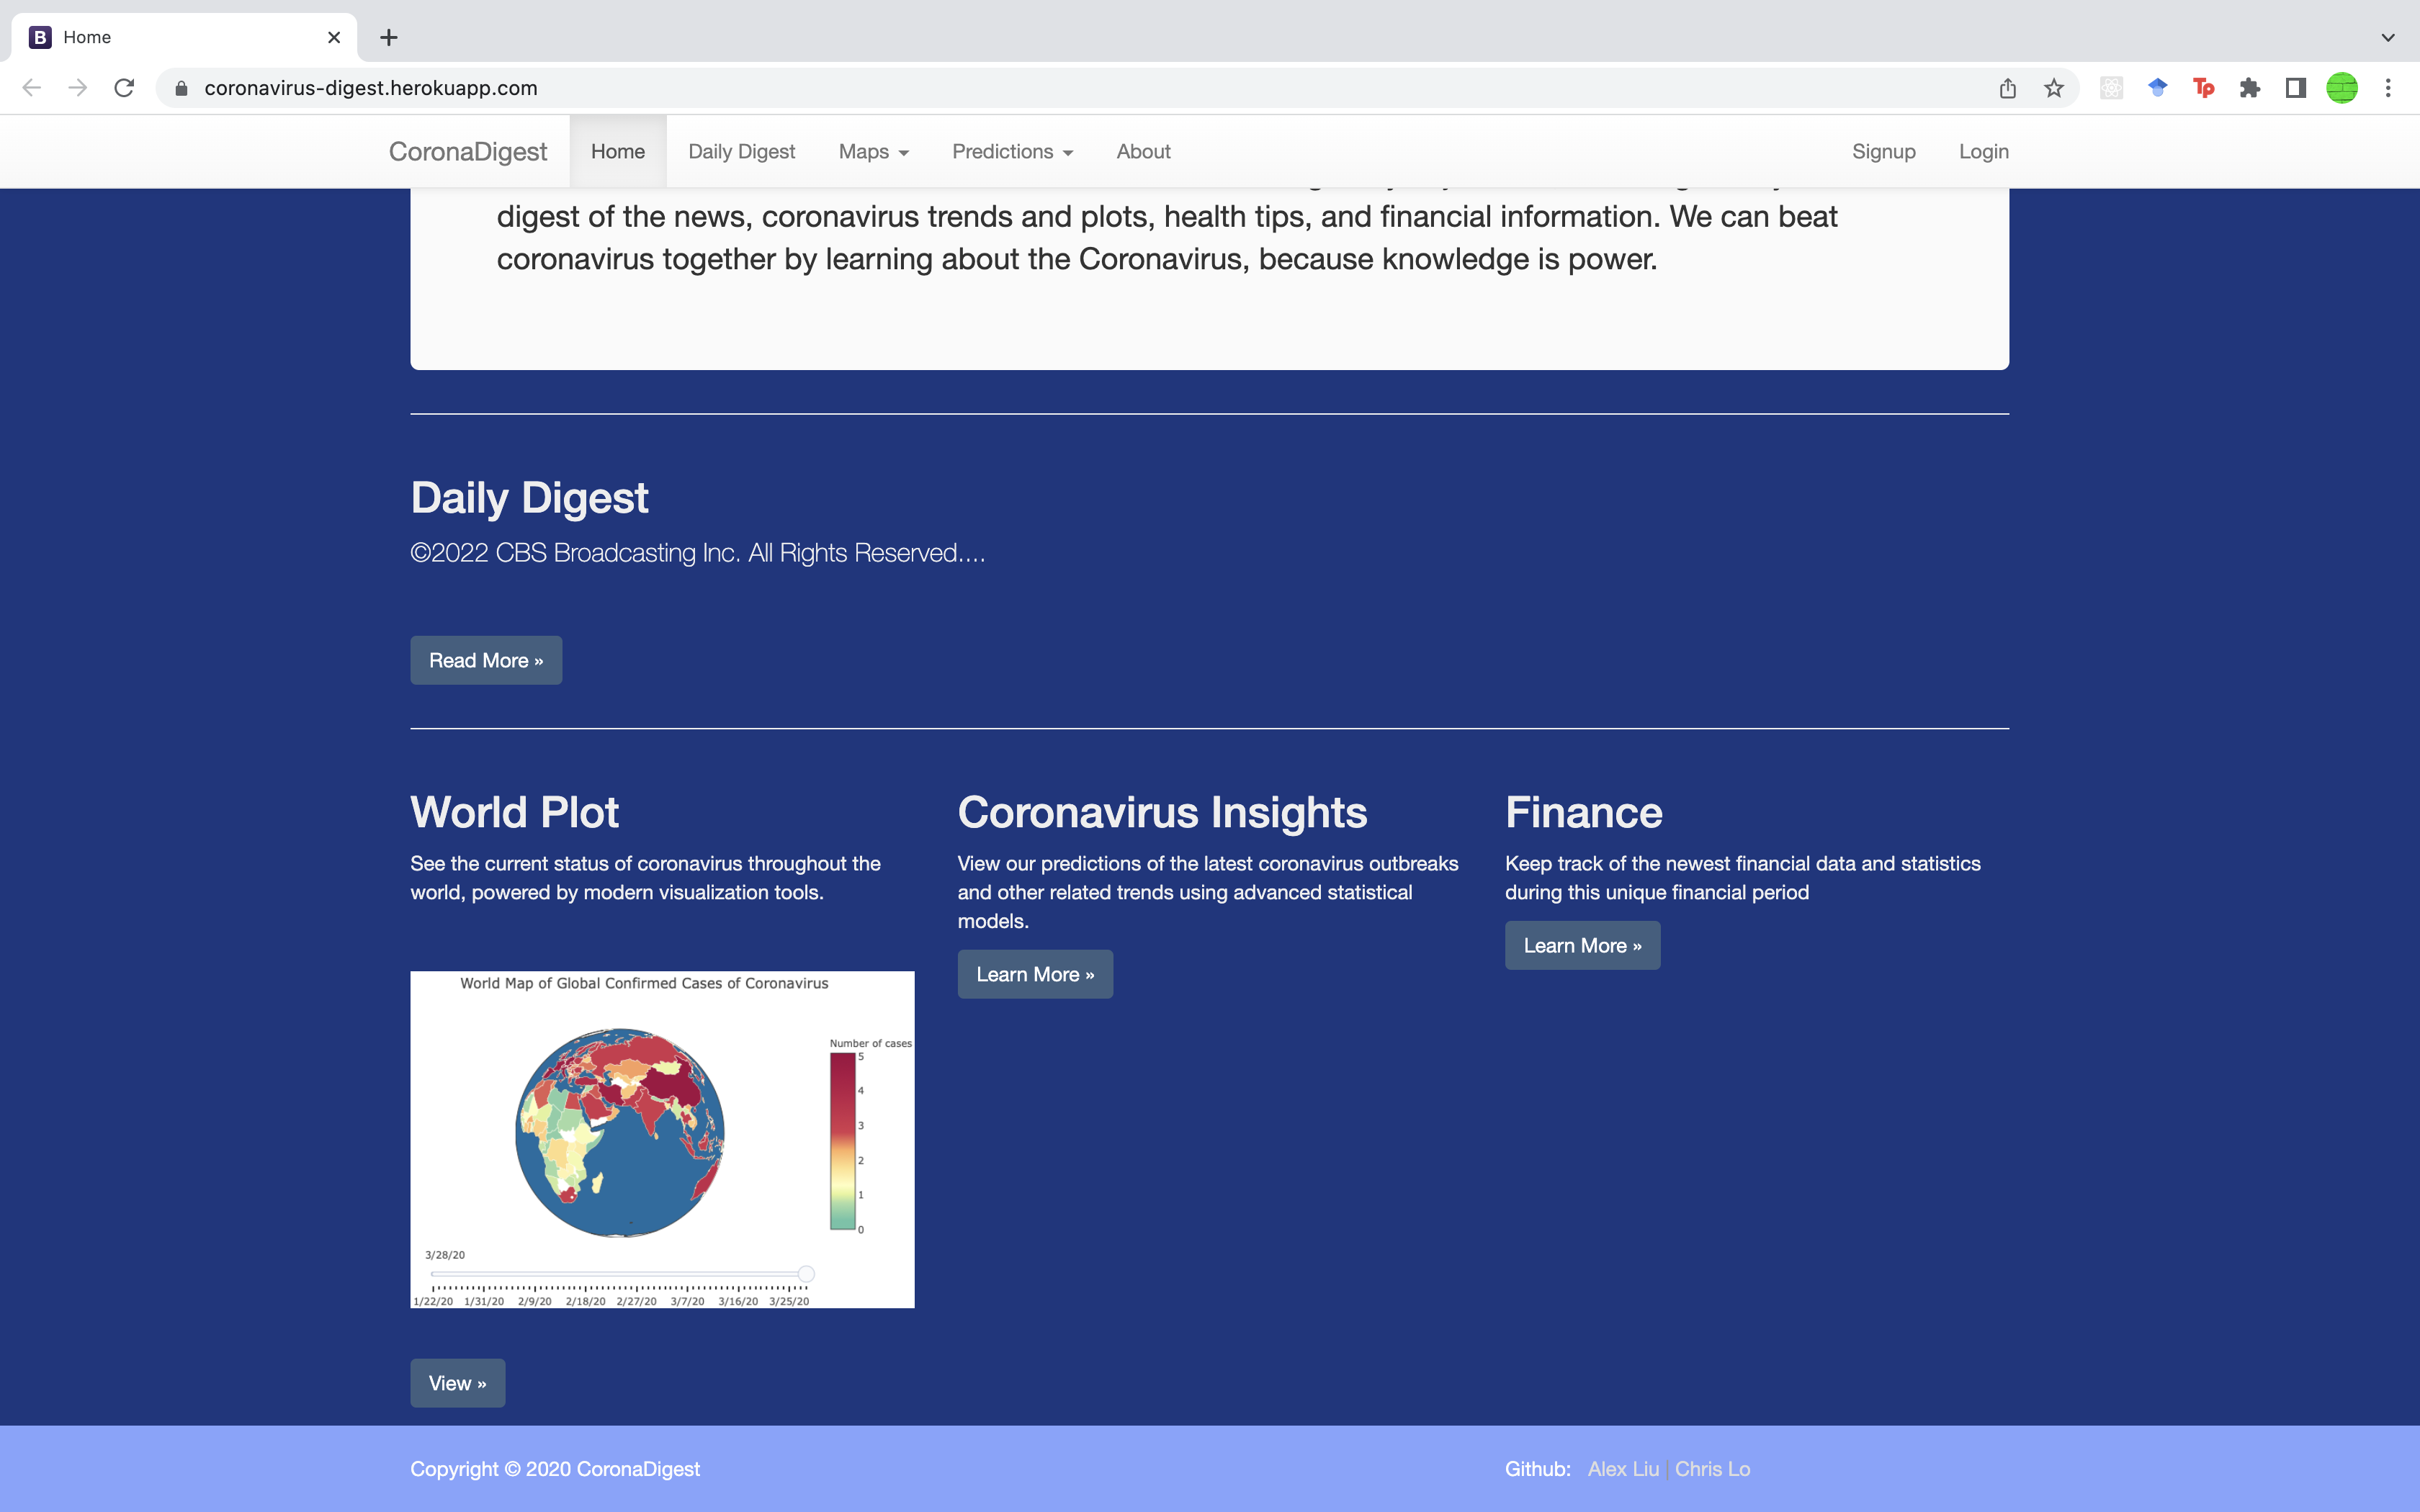
Home page of CoronaDigest, my project for HooHacks 2020
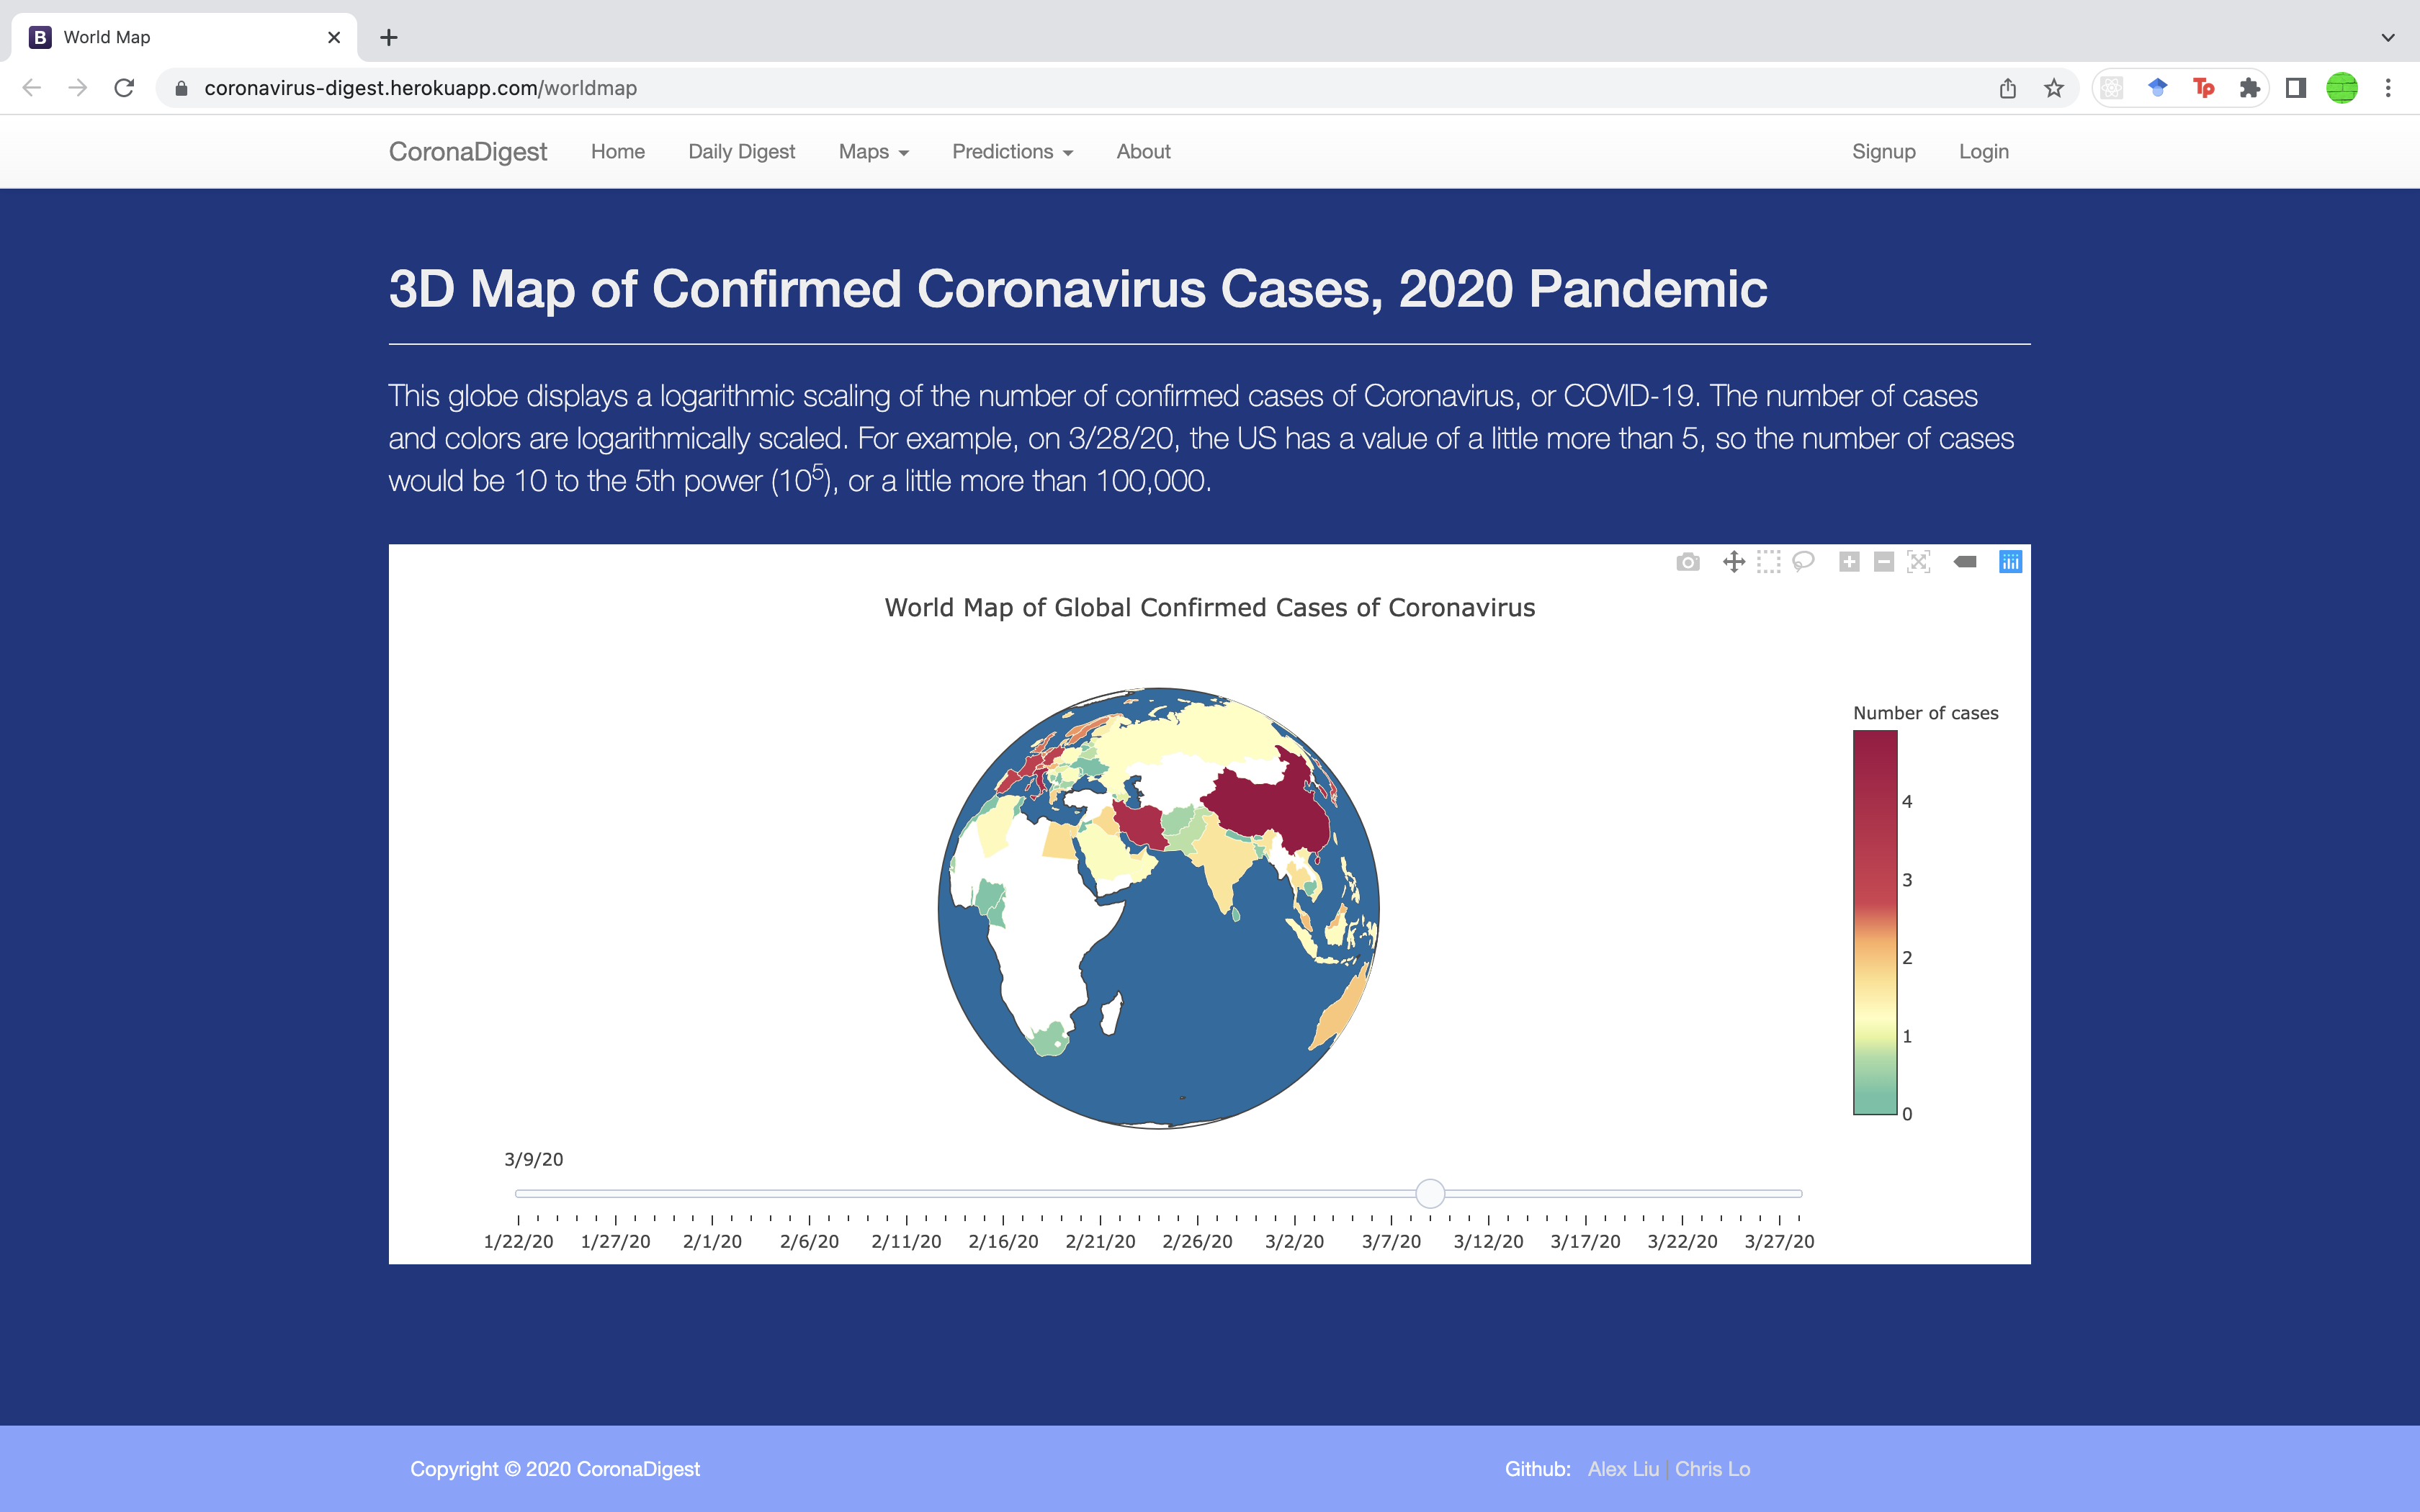
3D Globe visualization made with matplotlib + seaborn
CreatingTheNext: Tracking unemployment patterns
- Used matplotlib to make unemployment graphs
- Flask for simple web interface
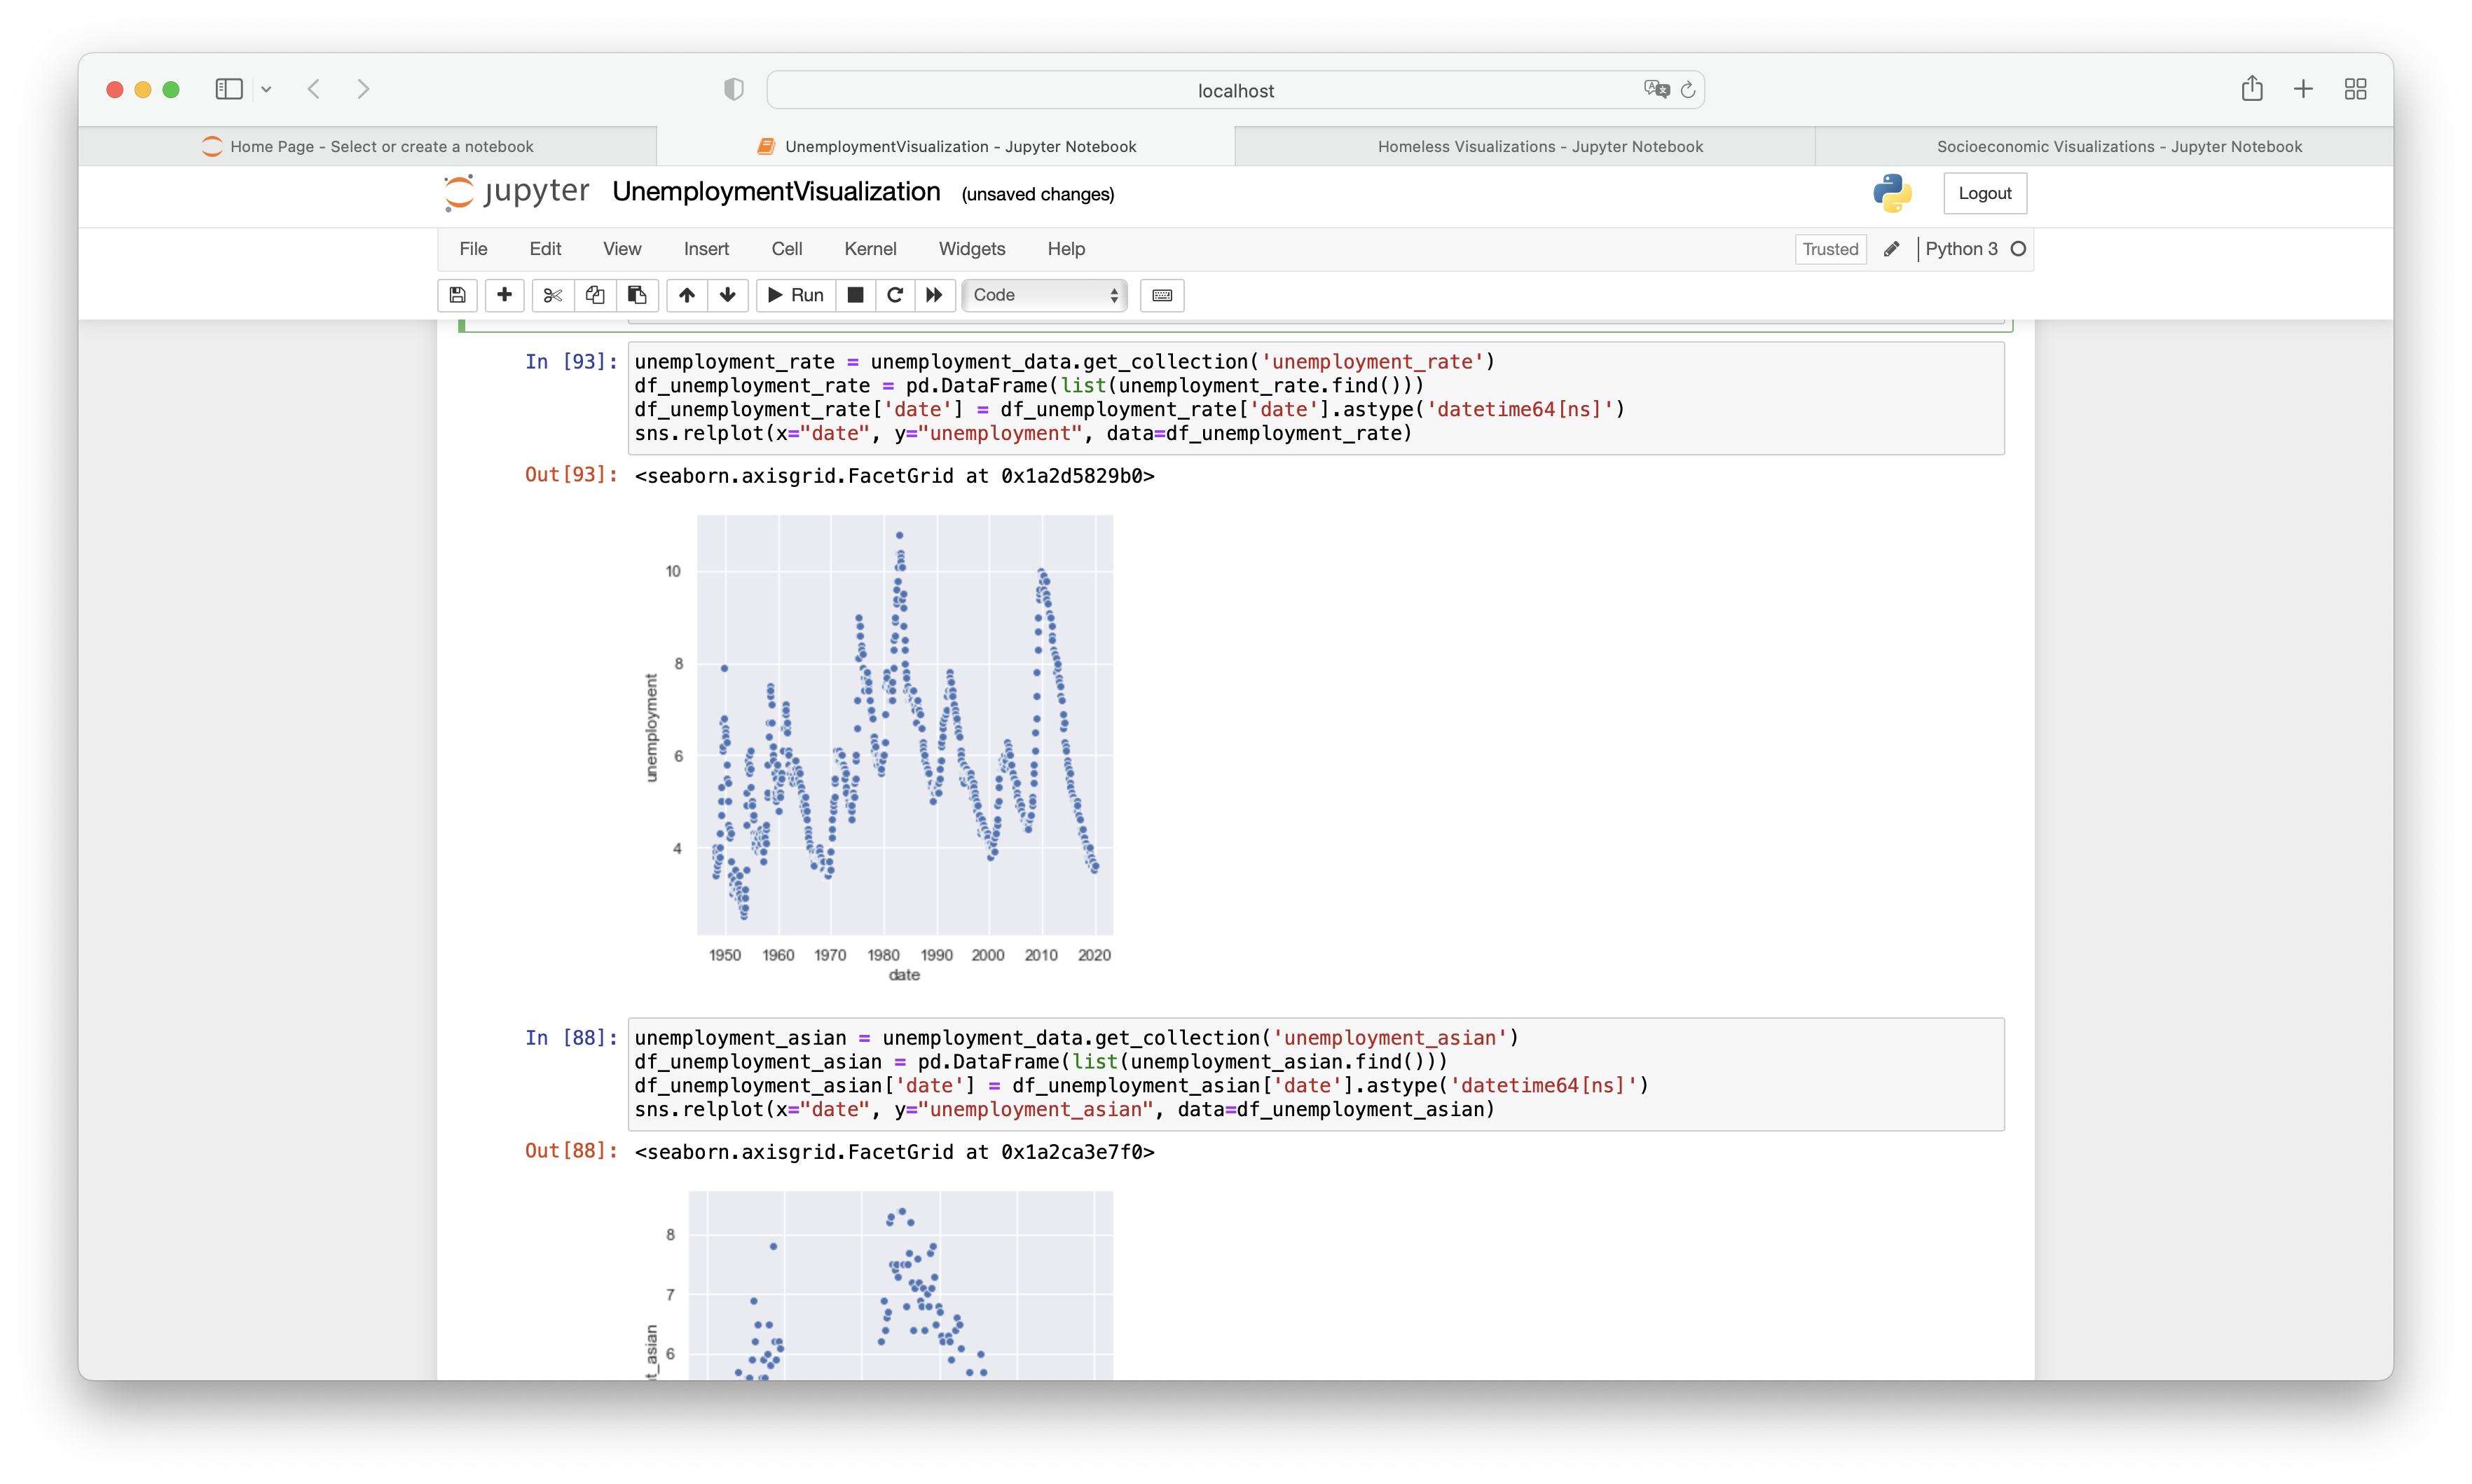
Matplolib line graphs visualizing unemployment trends